
Performance Tracking
What is Performance Tracking?
Performance Tracking for labelling pipelines is the active process of recording and evaluating the accuracy and consistency of annotations made by human annotators. It involves tagging annotation tasks with quantitative metrics that project leads can utilize to monitor progress and performance.
How Can You Effectively Utilize Performance Tracking in Your Nexus Project?
The Performance Tracker page can be found in the Automation section in your project. If you have made any annotations in your project, the Performance tab will reveal a dashboard containing various graphs and quantitative metrics. The metrics are saved and collected by the day, and the dashboard provides filters such as the ability to restrict the time range to the past 7 days, 30 days, 3 months, 6 months, and 12 months, as well as the ability to look at the annotation workflow for specific collaborators in the Nexus project.
The Performance Tracker Page can be found in the Automation Section in your Project
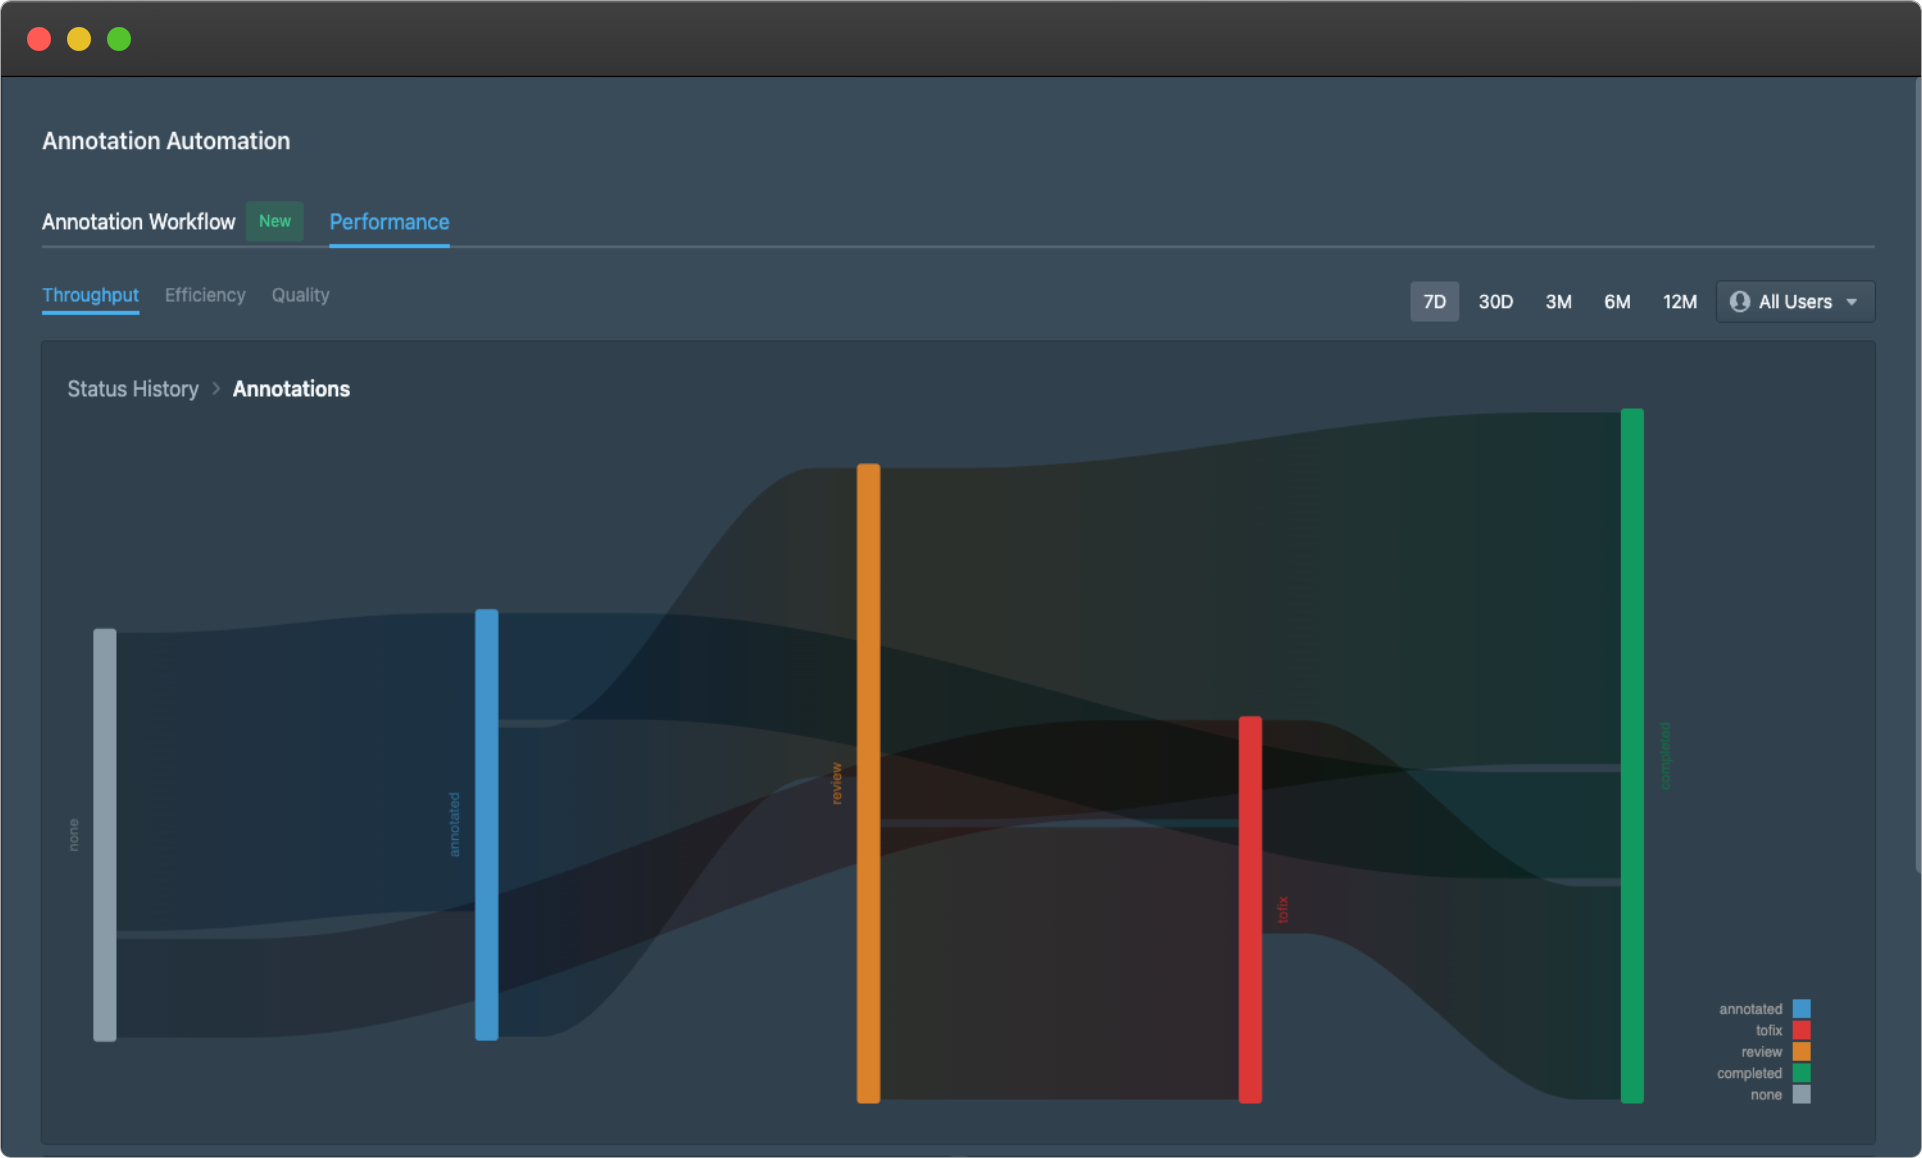
The most prominent graph is a Sankey chart that tracks the annotation progress of the whole project. Assets are aggregated based on their annotation status and the current stage of the annotation workflow. It consists of five main categories:
- None - shows the number of assets that are yet to be annotated.
- Annotated - shows the number of assets that have been annotated and submitted to the next stage.
- Review - shows the number of annotated assets that are being reviewed. This includes assets that are in the consensus stage.
- To Fix - shows the number of annotated assets that have been rejected during review and are sent for re-annotation.
- Completed - shows the number of annotated assets that are ready to be used for training.
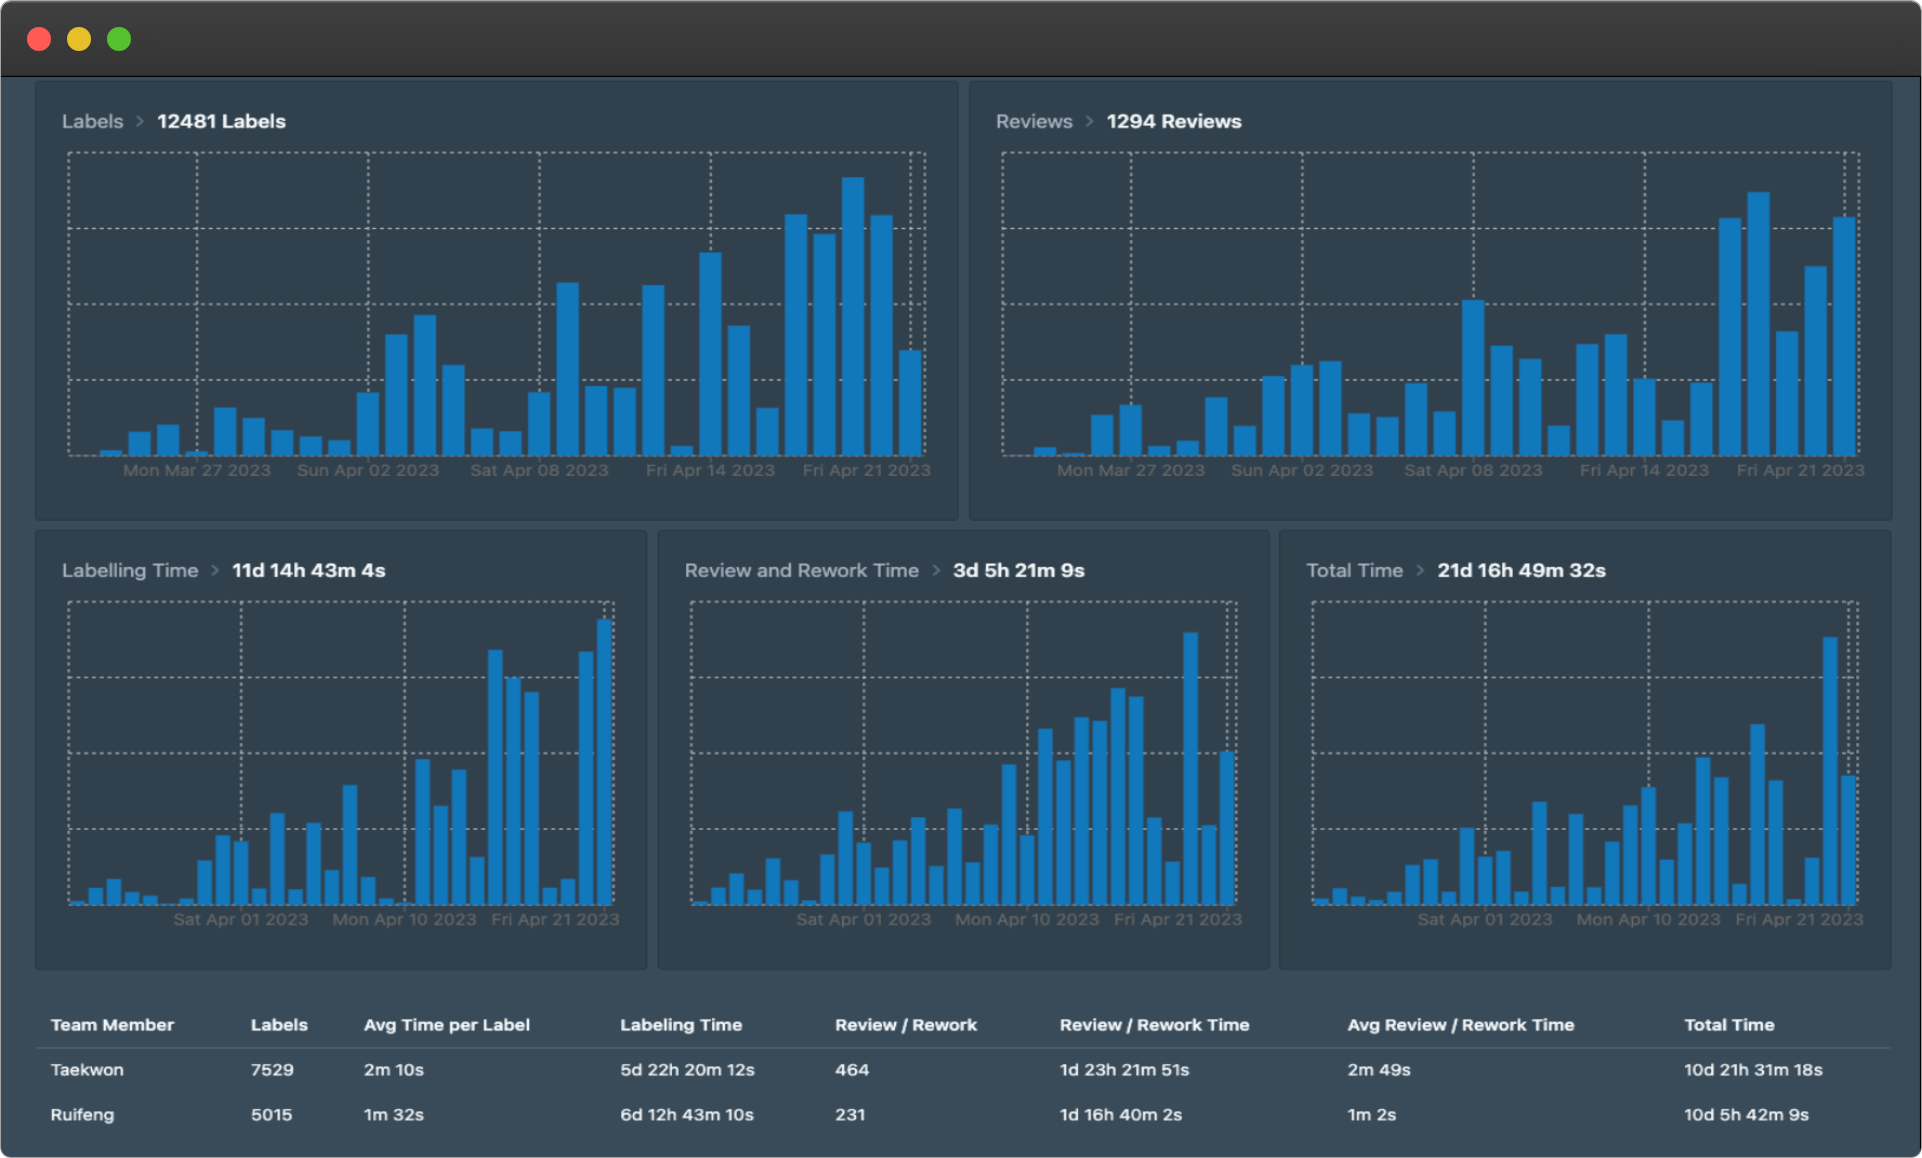
Track various metrics using the bar graphs
There are also five bar graphs that track various metrics over time. The main metrics that are covered daily are as follows:
- The number of annotations or labels annotated
- The number of reviews completed for annotated assets
- The total amount of time used for labelling
- The total amount of time used to review and rework labels
These charts will be automatically updated daily to allow you track the progress of the annotations at their various stages, and how they vary day by day. Through tracking these metrics, you can see whether you are labelling at the pace you expect, which stages take the most time, and how efficiently your individual labellers are annotating. This provides teams with quantitative metrics to determine what the main blockers in the annotation pipeline are, and help to guide and substantiate specific actionable improvements for the pipeline.
👋 Need help? Contact us via website or email
🚀 Join our Slack Community
💻 For more resources: Blog | GitHub | Tutorial Page
🛠️ Need Technical Assistance? Connect with Datature Experts or chat with us via the chat button below 👇
Updated 11 months ago