
Advanced Evaluation for Model Performance
Advanced Evaluation
Next to the Metrics Tab, you can now select a new feature which shows sample inference by the model at evaluation checkpoints through direct comparison between Ground Truth and Checkpoint Prediction. On the Controls Panel on the right, you can hide and show the labels, display the tag name as well as the confidence metric for how confident the model is in the prediction, as well as a sliding bar to compare inference at each evaluation checkpoint for the same image to analyse how the model is progressing in learning to perform your chosen tasks.
The image below displays an example of the advanced evaluation page.
.png")
Advanced Evaluation Example (Click image to enlarge)
Confusion Matrix
Nexus’ Confusion Matrix can be used as another form of evaluation during training, alongside other features like our real-time training dashboard and Advanced Evaluation. During training, the Confusion Matrix tab can be found at the top of the training dashboard, in the Run page, as shown below.
Our confusion matrix is computed in exactly the methods described here, with ground truth classes being represented as columns, and the prediction classes represented as rows. To aid in ease of interpretability, it uses color gradients to highlight differences in distributions, where lighter colors represent low proportions and darker colors represent higher proportions.
Background Class
To improve the user experience, we’ve also added a few options to improve interpretability. In the default view, the background class entries are omitted, but these can be toggled with ‘Yes’ or ‘No’ buttons under Background Class. The background class represents any area in which there is no object of interest. How area is interpreted depends on what computer vision task is involved. For classification, background class can be assigned to a whole image. For semantic segmentation, background class is assigned on a per-pixel basis. For instance segmentation, object detection, and keypoint detection, background class is assigned to spatial regions that have no class instances in them, so if an annotation is assigned background class as the ground-truth, that means there was no annotation at all. If a predicted annotation has the background class, then it means there was no prediction made.
The background class entries can be toggled with ‘Yes’ or ‘No’ buttons under Background Class.
Additionally, in the default view, the confusion matrix is normalized based on ground truth, meaning that the numbers are percentages calculated row-wise. This means that the sum of all the entries over the row is 100%. These normalized values provide the proportion of confusion to other classes for each model’s predicted class, as well as the precision per class along the diagonal. This will automatically update to include or not include the background class, depending on whether it is toggled on or off. The percentage view allows users to more easily perceive the distribution of results that can occur. One can still view the raw computed values before normalizing by selecting Absolute. This will allow users to view and verify the underlying values.
Finally, similar to Advanced Evaluation, one can scroll across the evaluation checkpoints to see how the confusion matrix for the model has evolved. Ideally, one should observe that the proportions for each row should converge towards the downward diagonal, such that prediction and ground truth classes are maximally aligned.
Training Log
Another tab that will provide more transparency for the user is our direct logs for the training data as it is ongoing. This makes it easy for you to copy and parse results for your documentation and shows transparency on the training processes on our end to show exactly the logs we register and the data we use to render our graphs.
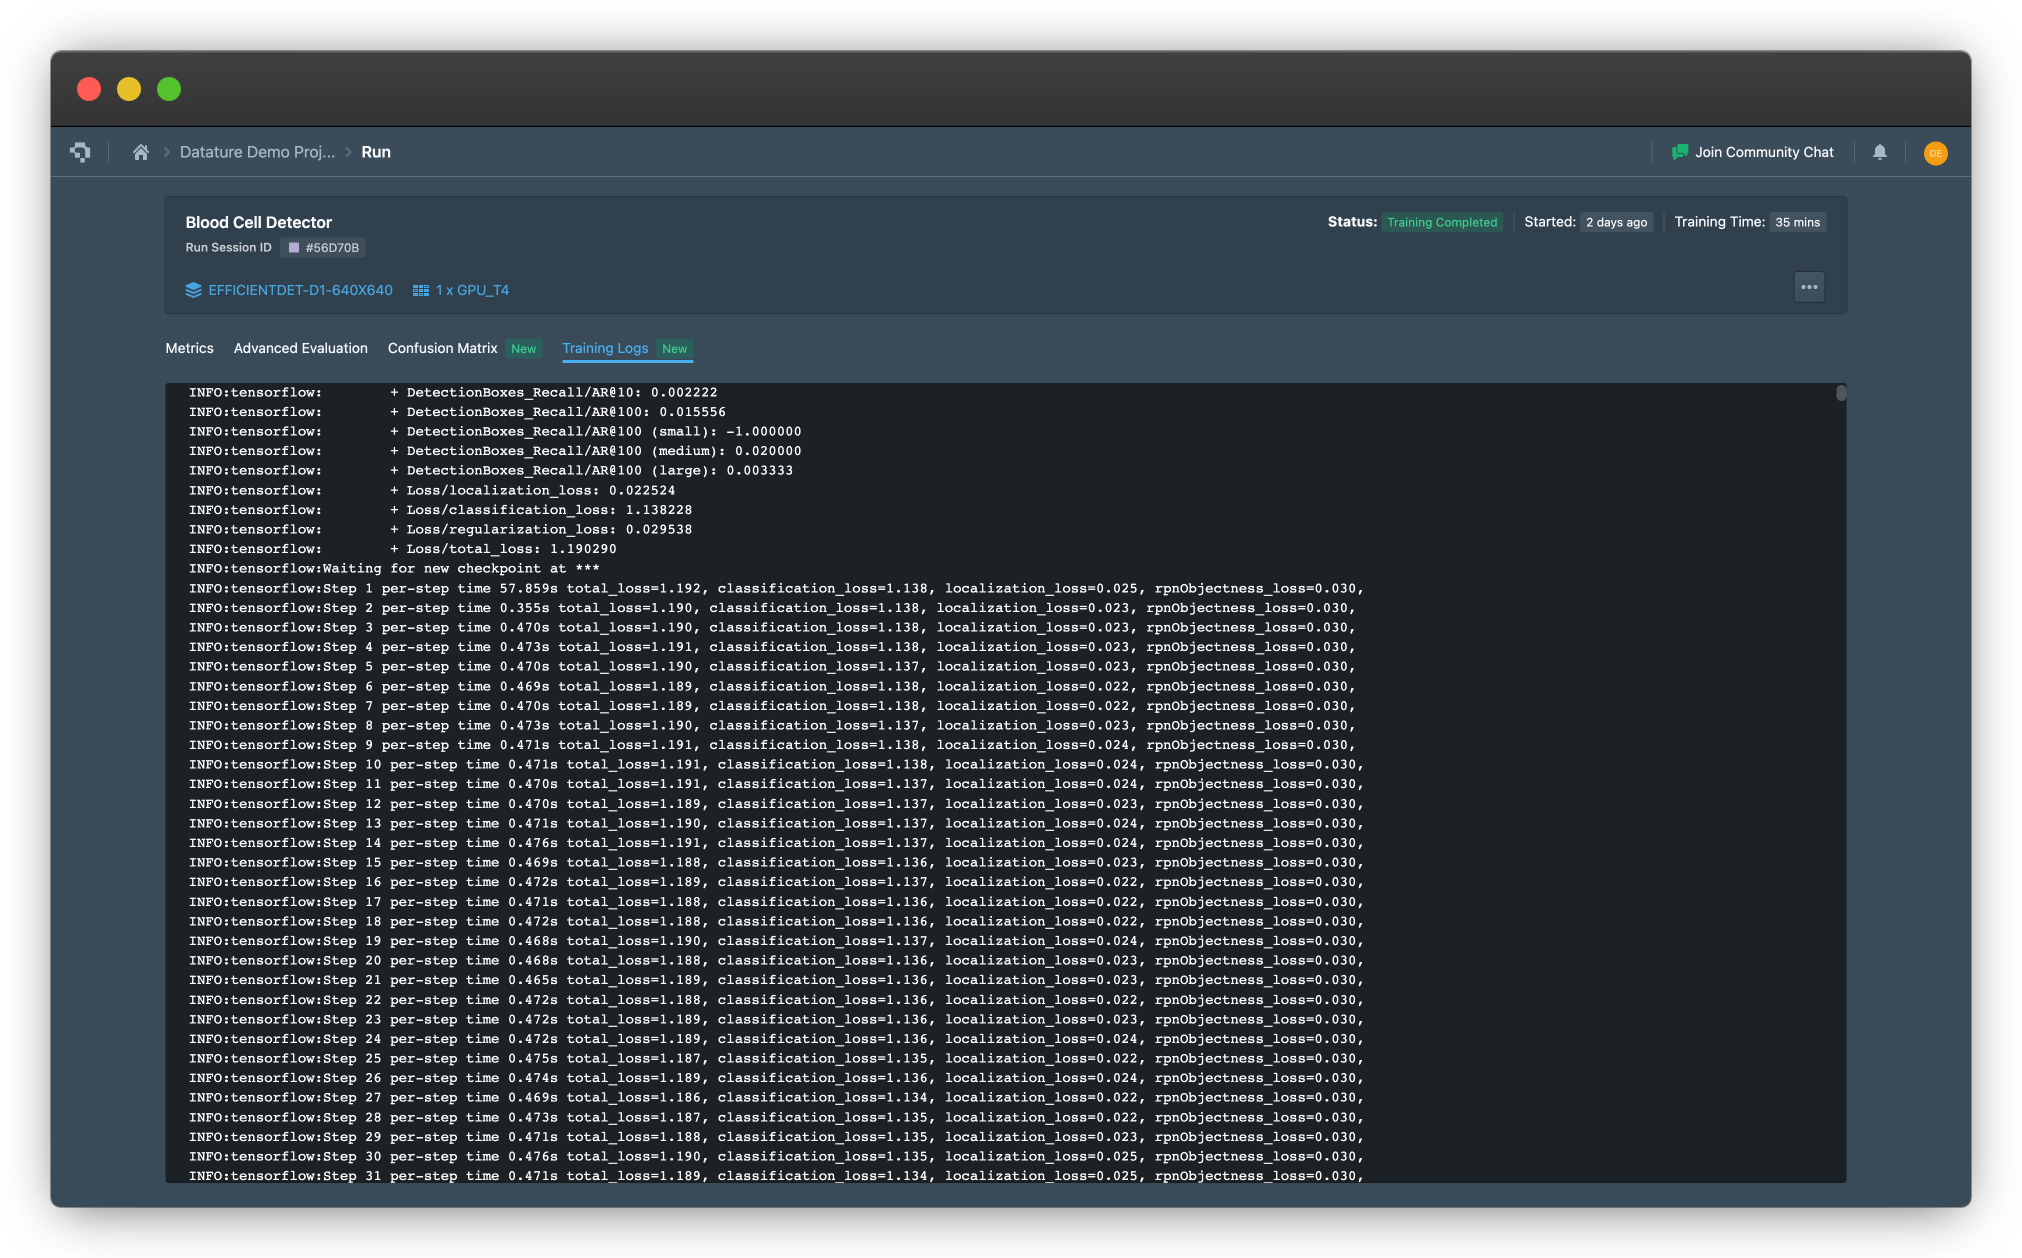
Example of a Training Log in a Training Run (click on image to enlarge)
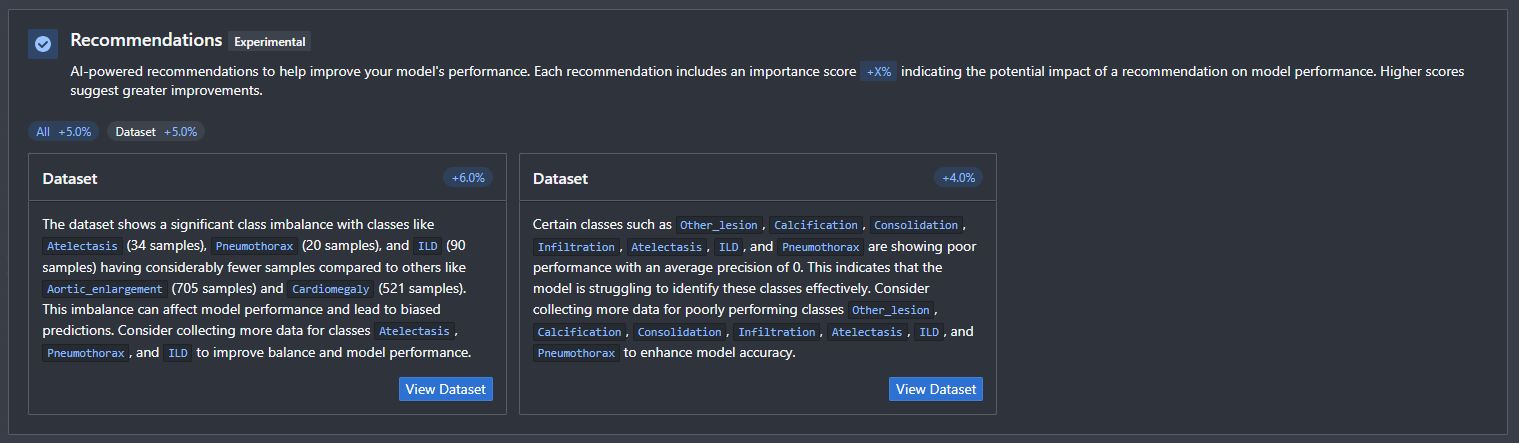
Recommendations
The Recommendations tab shows a generated report based on the dataset and training information generated from the run. The top section describes the checkpoint strategy used in the training, the training dataset size, and validation dataset size.
Recommendations
This section contains various AI-powered recommendations to help improve your next model training. Each recommendation also includes an importance score indicating its potential impact. The recommendation is translated from statistical insights into natural English to enable easier adaptation for users.
Assets With Lowest Confidence Scores
We display assets with the lowest confidence scores to show where the model is uncertain. This can help with inaccurately labelled images and also identify whether a dataset is underrepresenting similar images or unable to learn more difficult examples. We provide filters to look at only certain tags as well as a confidence threshold to show all predictions at various thresholds as well as links out to the images in the annotator.

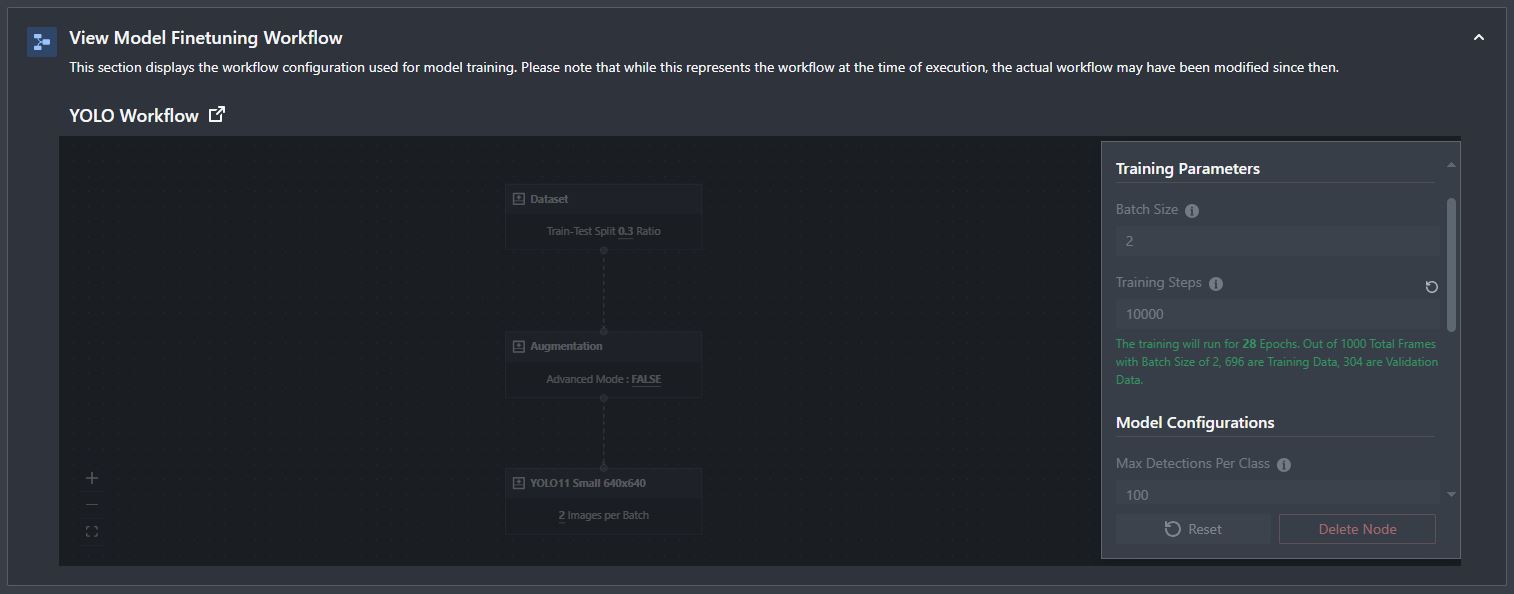
View Model Finetuning Workflow
The model finetuning workflow that was used to run the training is on display here, allowing you to check all of the settings you used. This is not affected by changes made after the training was initiated.
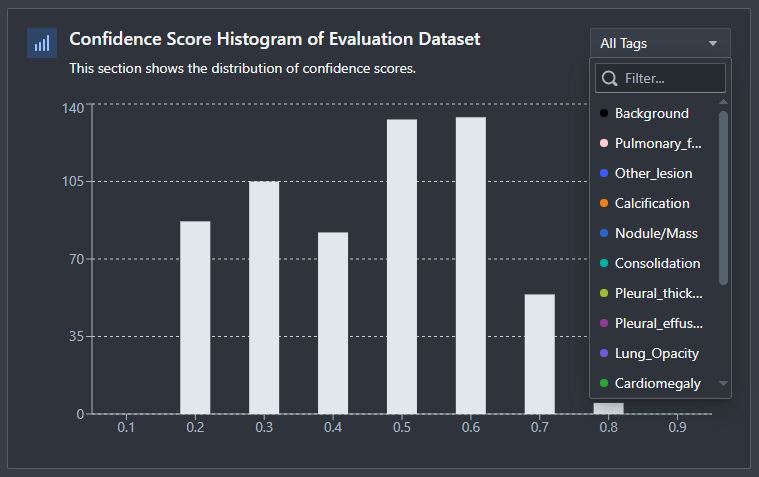
Confidence Score Histogram of Evaluation Dataset
The confidence score histogram allows you to see the distribution of confidence scores for each prediction and allows for tag based filtering to see how confidence scores change between tags.
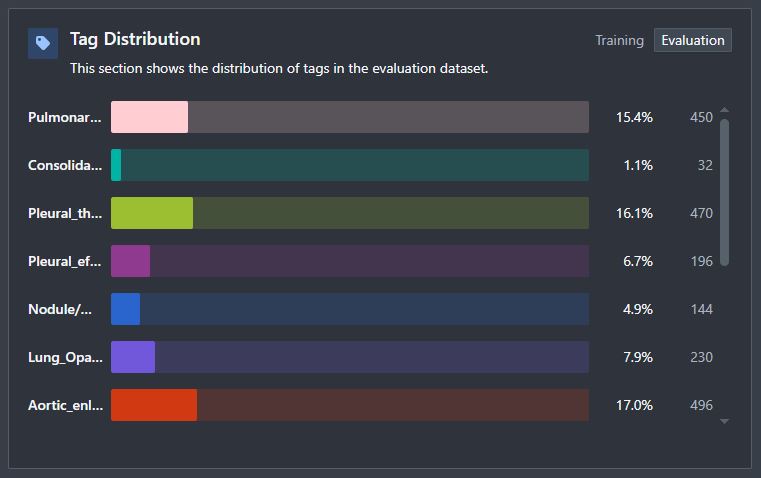
Tag Distribution
This shows the tag distribution in the evaluation and training datasets, allowing you to examine whether there were any disceprancies in distribution between the training and evaluation, and as well as highlight imbalances that exist throughout the dataset.
👋 Need help? Contact us via website or email
🚀 Join our Slack Community
💻 For more resources: Blog | GitHub | Tutorial Page
🛠️ Need Technical Assistance? Connect with Datature Experts or chat with us via the chat button below 👇
Updated 11 months ago