Running Inferences
After loading a model and uploading some images or videos, users can now proceed to running inferences. Portal also allows users to run either individual or bulk inferences.
Making Predictions
Single Prediction
To perform a prediction on a single image or video, simply choose your intended image or video, and click "Re-Analyse" (or pressing the 'a' key). The time taken for predictions will depend on the complexity of the model that is being used for predictions and whether you are using a mask or rectangle model.
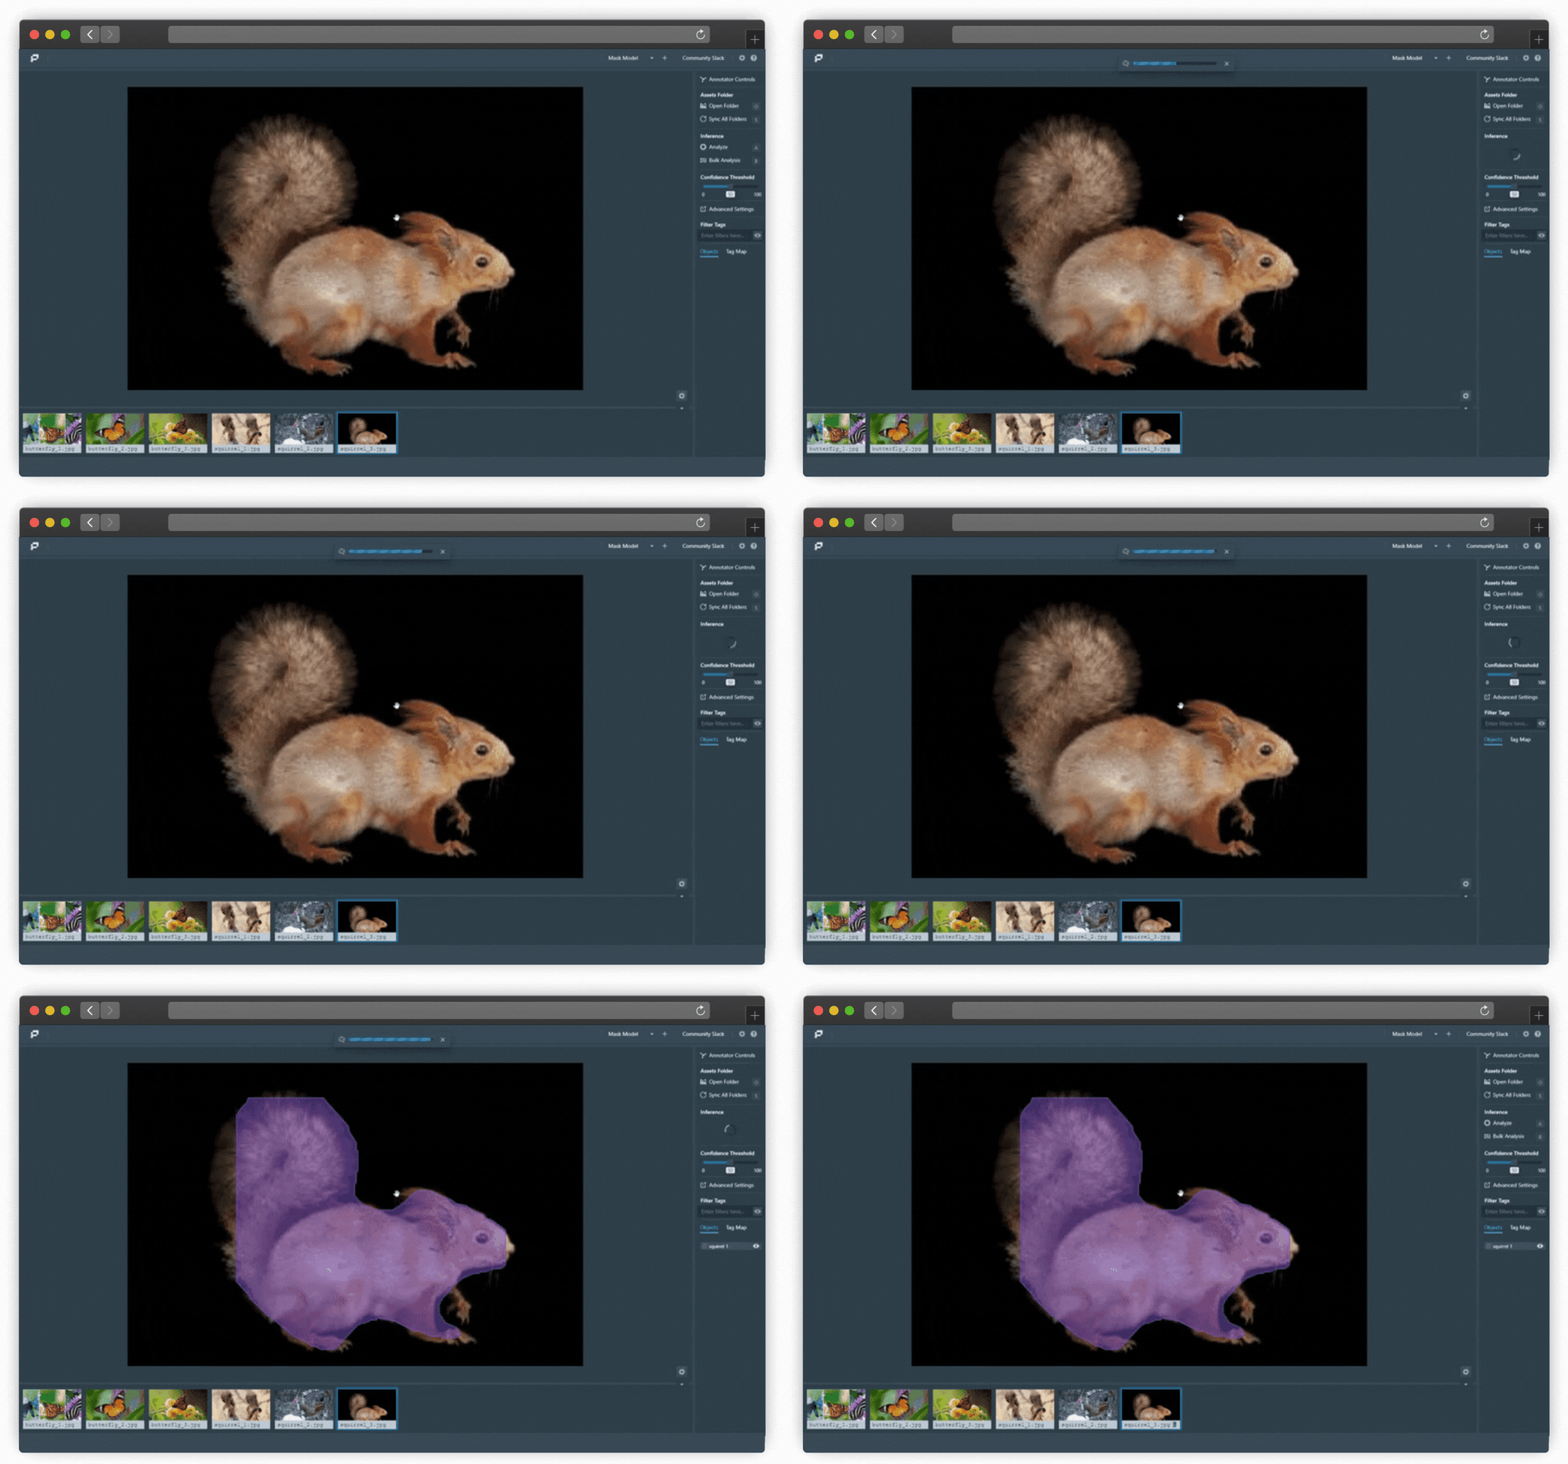
Single Prediction on Portal (Click image to enlarge)
Video Prediction
For video predictions, the loading bar will also reflect the estimated remaining duration until the prediction finishes. This is printed in the format mm:ss. Note that the time required to run inferences on videos depends on Frame Interval, which is discussed below.
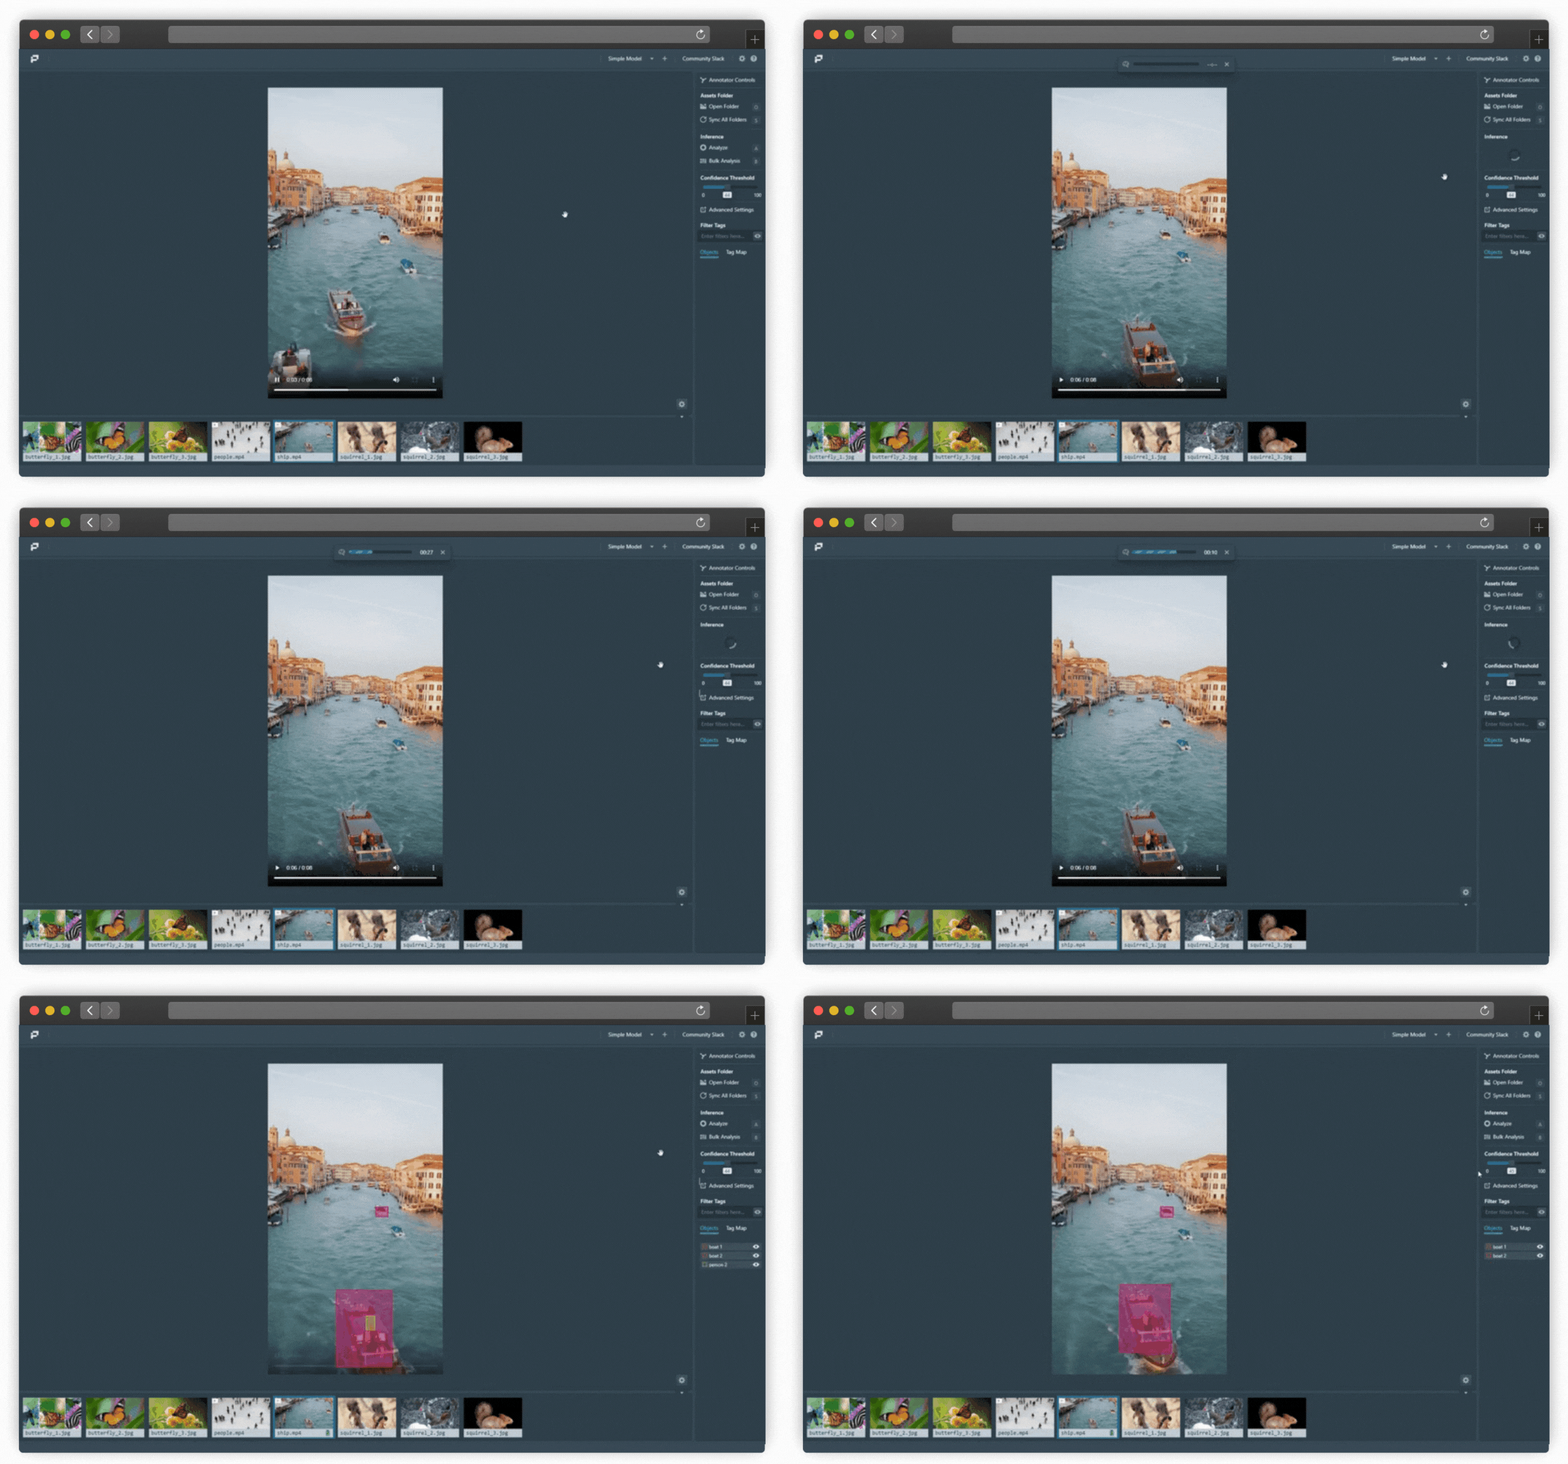
Video Prediction on Portal (Click image to enlarge)
Bulk Prediction
To perform a prediction on the entire list of images that was uploaded, click "Bulk Analysis" (or pressing the 'b' key).
For predicting videos, the progress bar will also show the current progress. The fraction of the progress bar filled corresponds to the fraction of completed analyzed files. The end result will be the joint result of single predictions on files based on your Advanced Settings.
Changing Prediction Settings
Changing the Confidence Thresholds of Predictions
Once predictions have been successfully made on an image or a video, you can use the Confidence Threshold slider to dynamically filter predictions that have confidence that are below your desired threshold.
Filtering Predictions Based on their Classes
Class based filtering can be performed under the Filter Tags section on the right toolbar.
Under the Filter Tags section, click on the Eye icon to toggle between open mode or closed mode.
To only see specified classes, ensure that the eye is open, then type the specific class name in the text field and hit enter.
To see everything but the specified classes, ensure that the eye is closed, then type the desired class names in the text fields and hit enter.
Hiding A Specific Prediction
To hide a specific prediction, find the name of the prediction corresponding to the prediction in the Objects tab located at the bottom of the right toolbar, then click on the Eye icon next to the prediction's name.
Canceling Predictions
To cancel a bulk prediction or a video prediction, click on the "x" button found at the loading bar.
Advanced Settings
More advanced settings pertaining to predictions can be found in the Advanced Settings interface, which can be found underneath the Confidence Threshold.
Upon clicking this, you'll see various settings for toggling Advanced Settings:
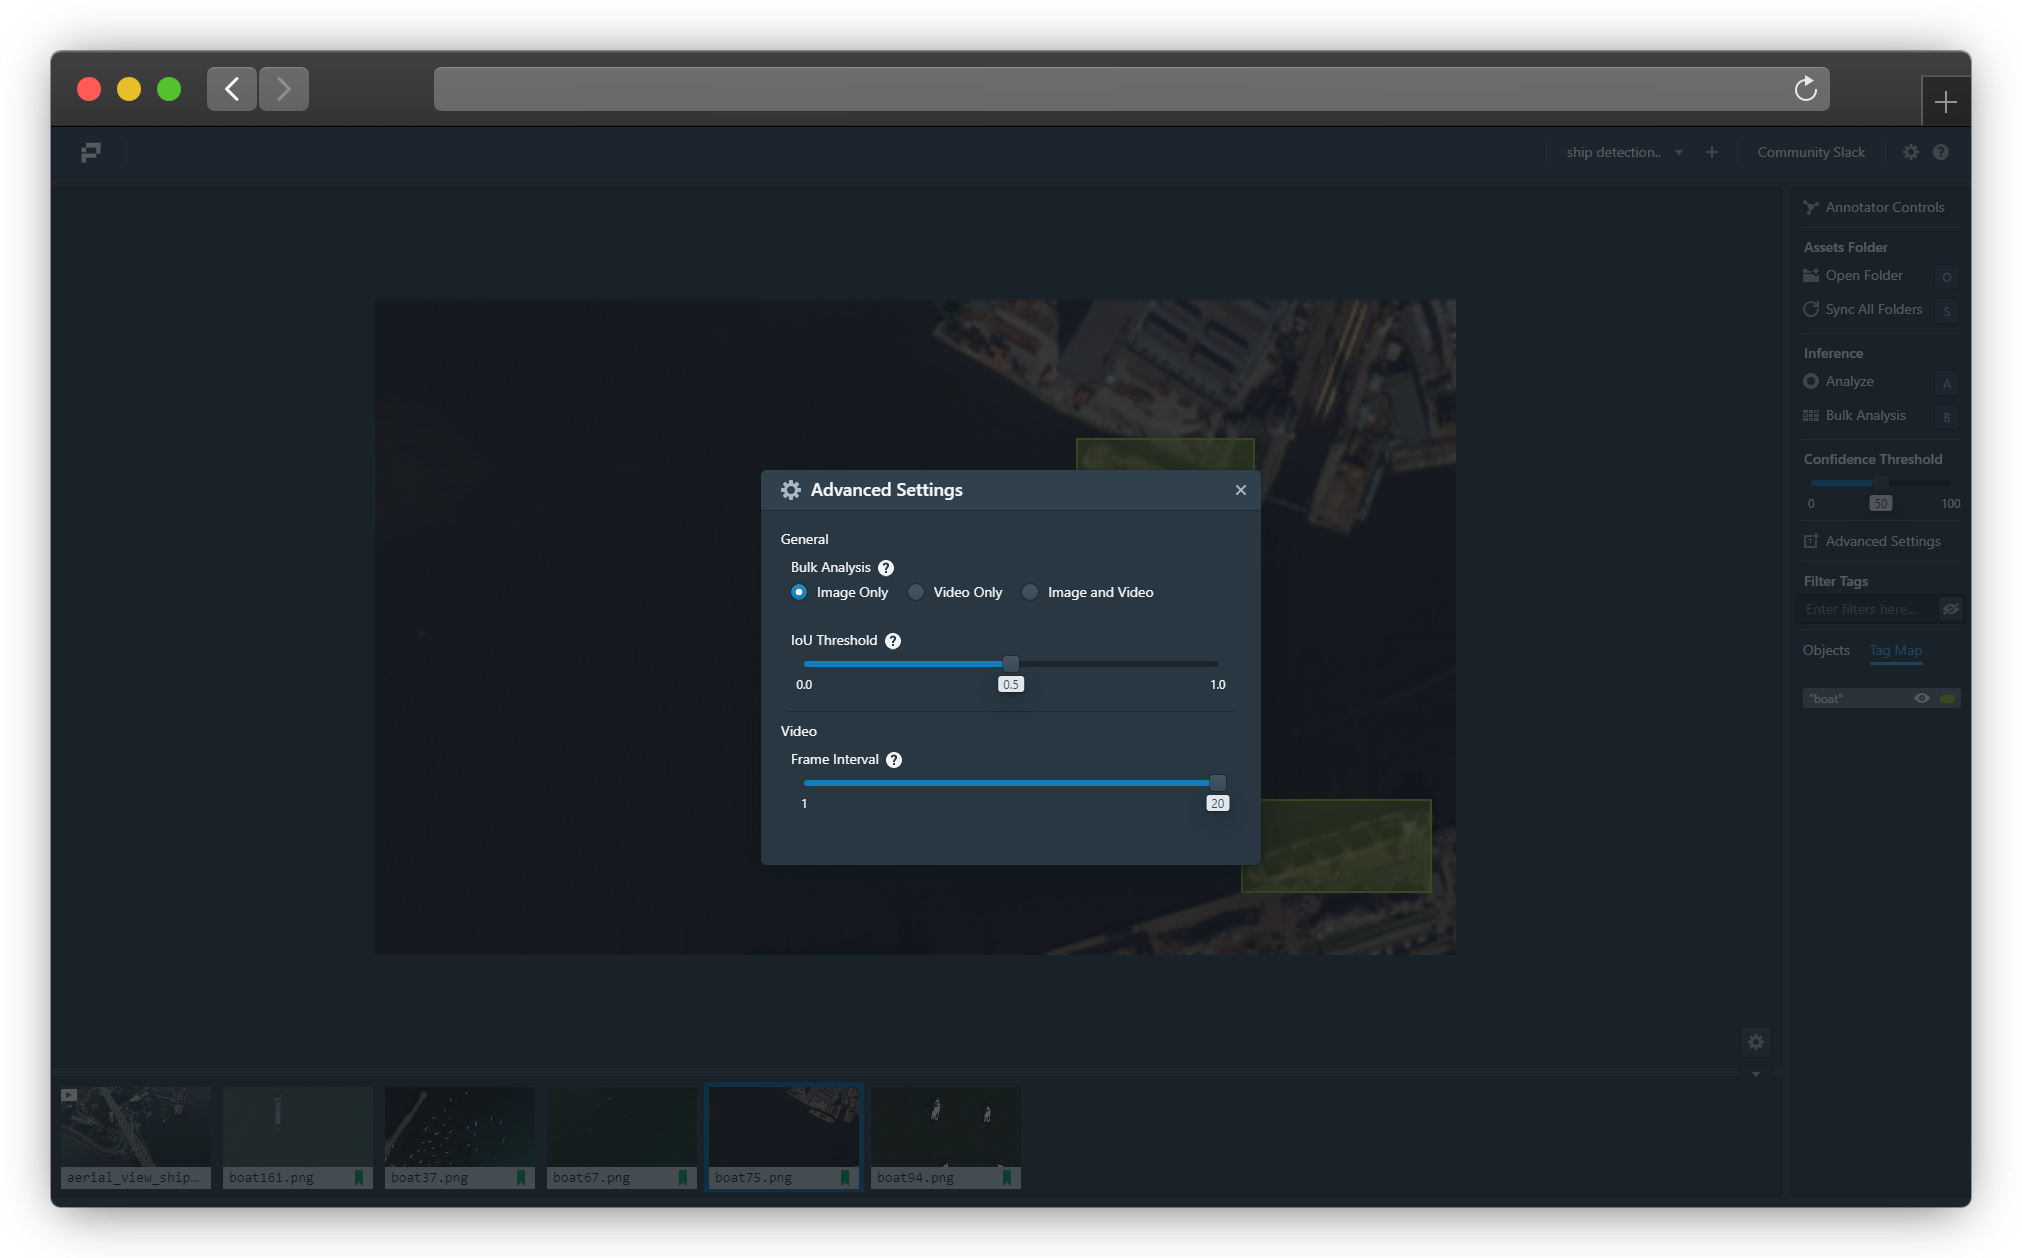
Accessing the Advanced Settings Interface (Click image to enlarge)
The first setting (in orange) is for the Bulk Prediction filter. This setting is for those would like to only bulk predict certain file types (only images, video or both) in order to save time.
Intersection over Union (IoU) Threshold
This pertains to the region highlighted in pink. IoU is a term used to define the extent of overlap of two boxes of the same label. The greater the region of overlap, the greater the IoU. Mathematically, this can be represented by the following formula:

Mathematical Formula of Intersection over Union (Click image to enlarge)
In the case of the IoU Threshold, this means excluding bounding boxes below the threshold. In other words, the higher the IoU Threshold, the stricter the maximally allowed overlap between 2 boxes.
To demonstrate an example of this, consider trying to infer Apple Bounding boxes from the image below. This is set at an IoU threshold of 0 (Default Threshold is 0.8). Observe how there is significant overlap between the bounding boxes.
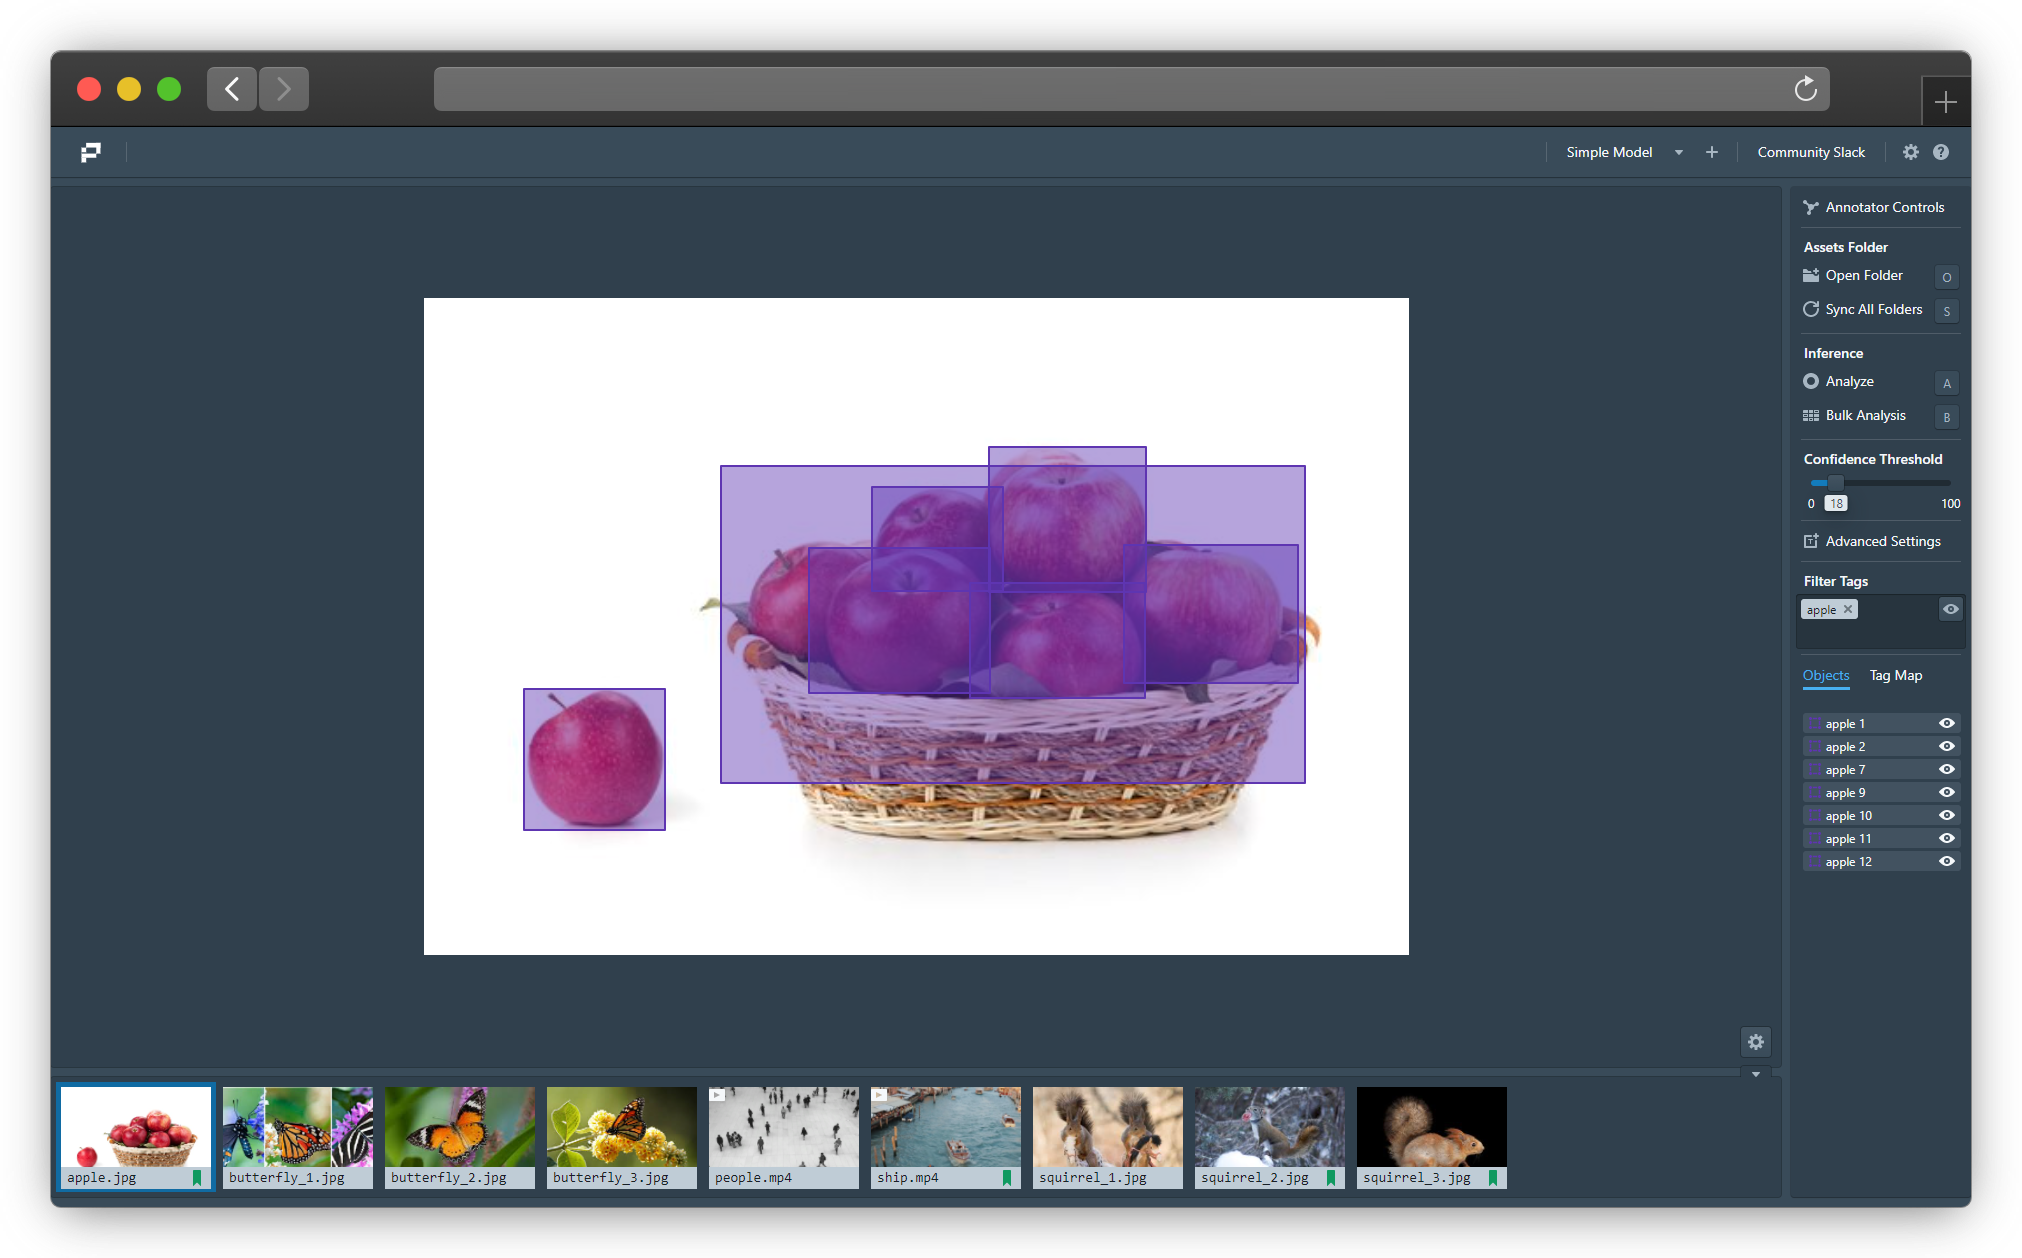
Bounding Boxes for IoU Threshold of 0, showing significant Box Overlap (Click image to enlarge)
This could be seen as a problem because the model could be oversensitive to the objects in the picture. Therefore, one might wish to filter out boxes with excessive overlap in order to counteract this. In the next example, we aim to do this by increasing the IoU Threshold to 0.9. This filters off bounding boxes with excessive overlap as shown below.
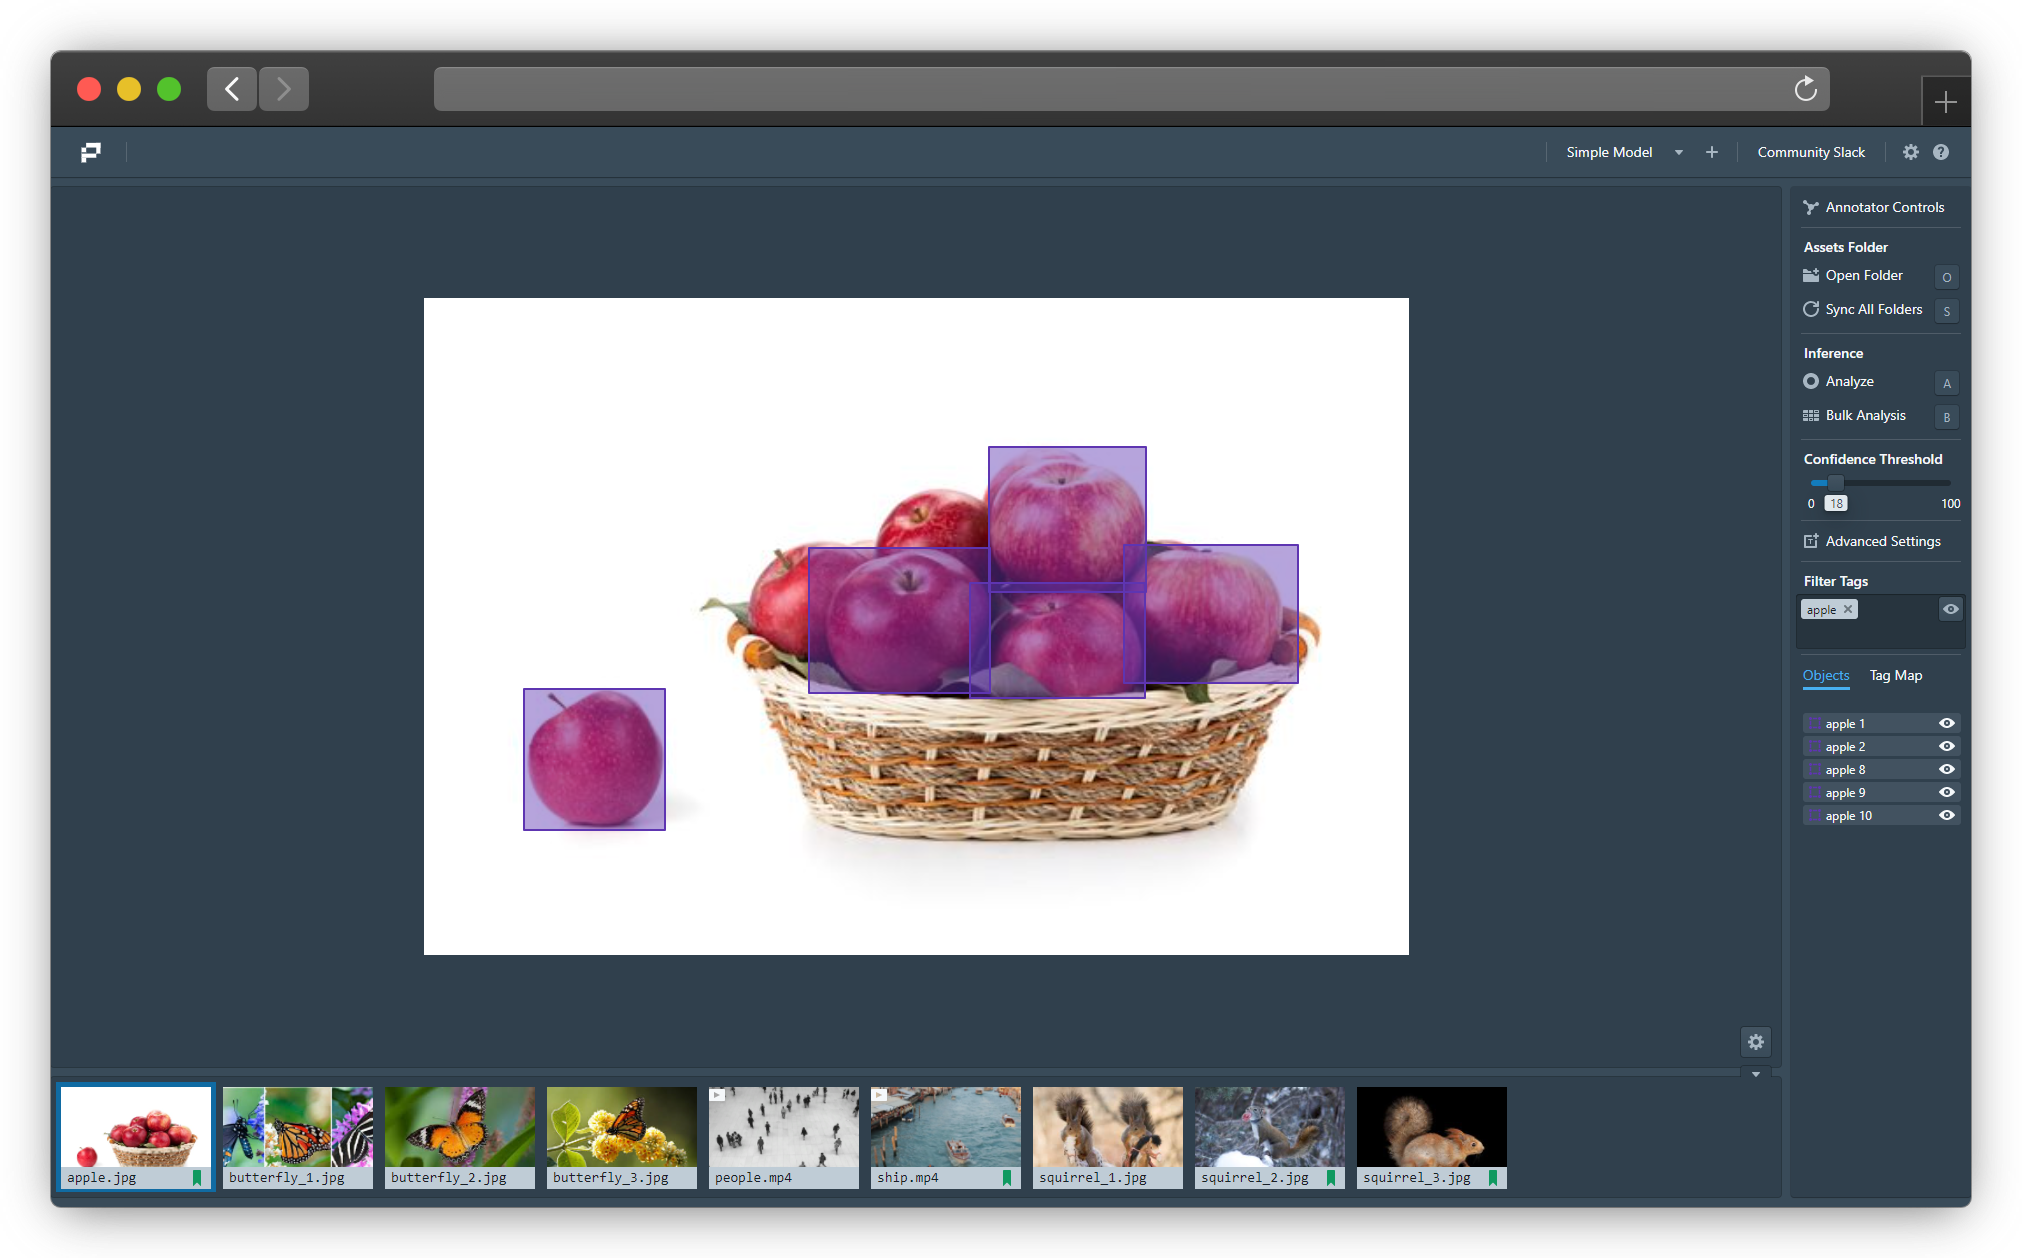
Bounding Boxes for IoU Threshold of 0.9, showing significantly less Box Overlap (Click image to enlarge)
Observe how the extent of overlap between the boxes is much lower. Essentially, IoU acts as a filter to minimize double-counting of bounding boxes. However, there is no one-size-fits-all threshold IoU for every model. Please tune your IoU based on what you deem fit for your model.
Frame Interval
This pertains to the region in green. The Frame Sampling Interval to the number of frames played per prediction generated. To illustrate, if the Frame Interval is 1, that means 1 prediction is generated every frame. If the Frame Interval is 20, that means 1 prediction is generated every 20 frames.
Consider the below example where the same video is predicted with the same confidence threshold and model used. However, the Frame Interval is different. Below shows the video with the higher Frame Interval.
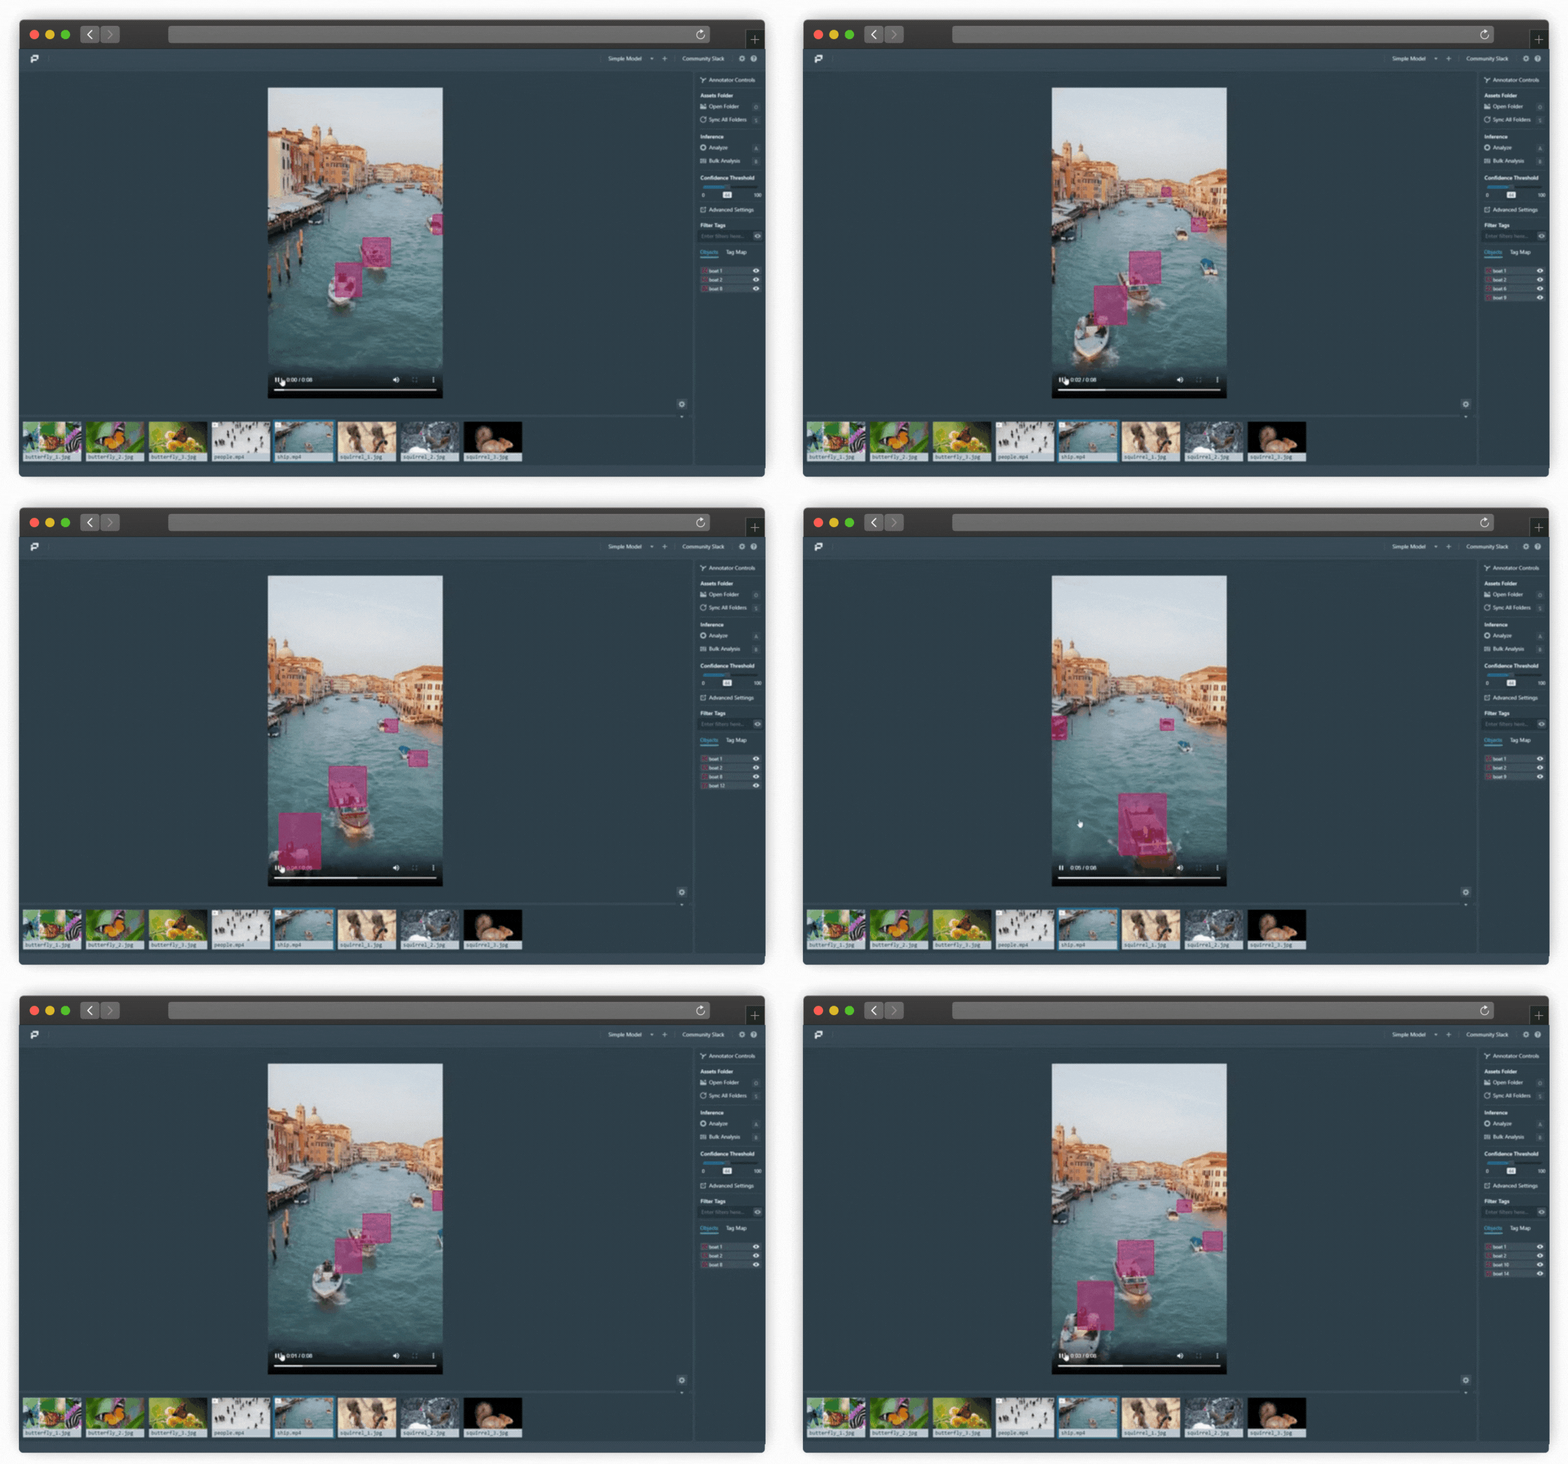
Larger Frame Interval Example (Click image to enlarge)
Use a lower Frame Interval if you'd like to prioritize the quality of predictions. However, use a higher interval to minimizing the time required to render predictions.
As seen from this example, the video is playing normally but there is a sizable time lag between each prediction. Some users might prefer higher fidelity for their predictions. In the next example, we use a lower frame interval of 10, which has a comparatively much lower time lag between each prediction.
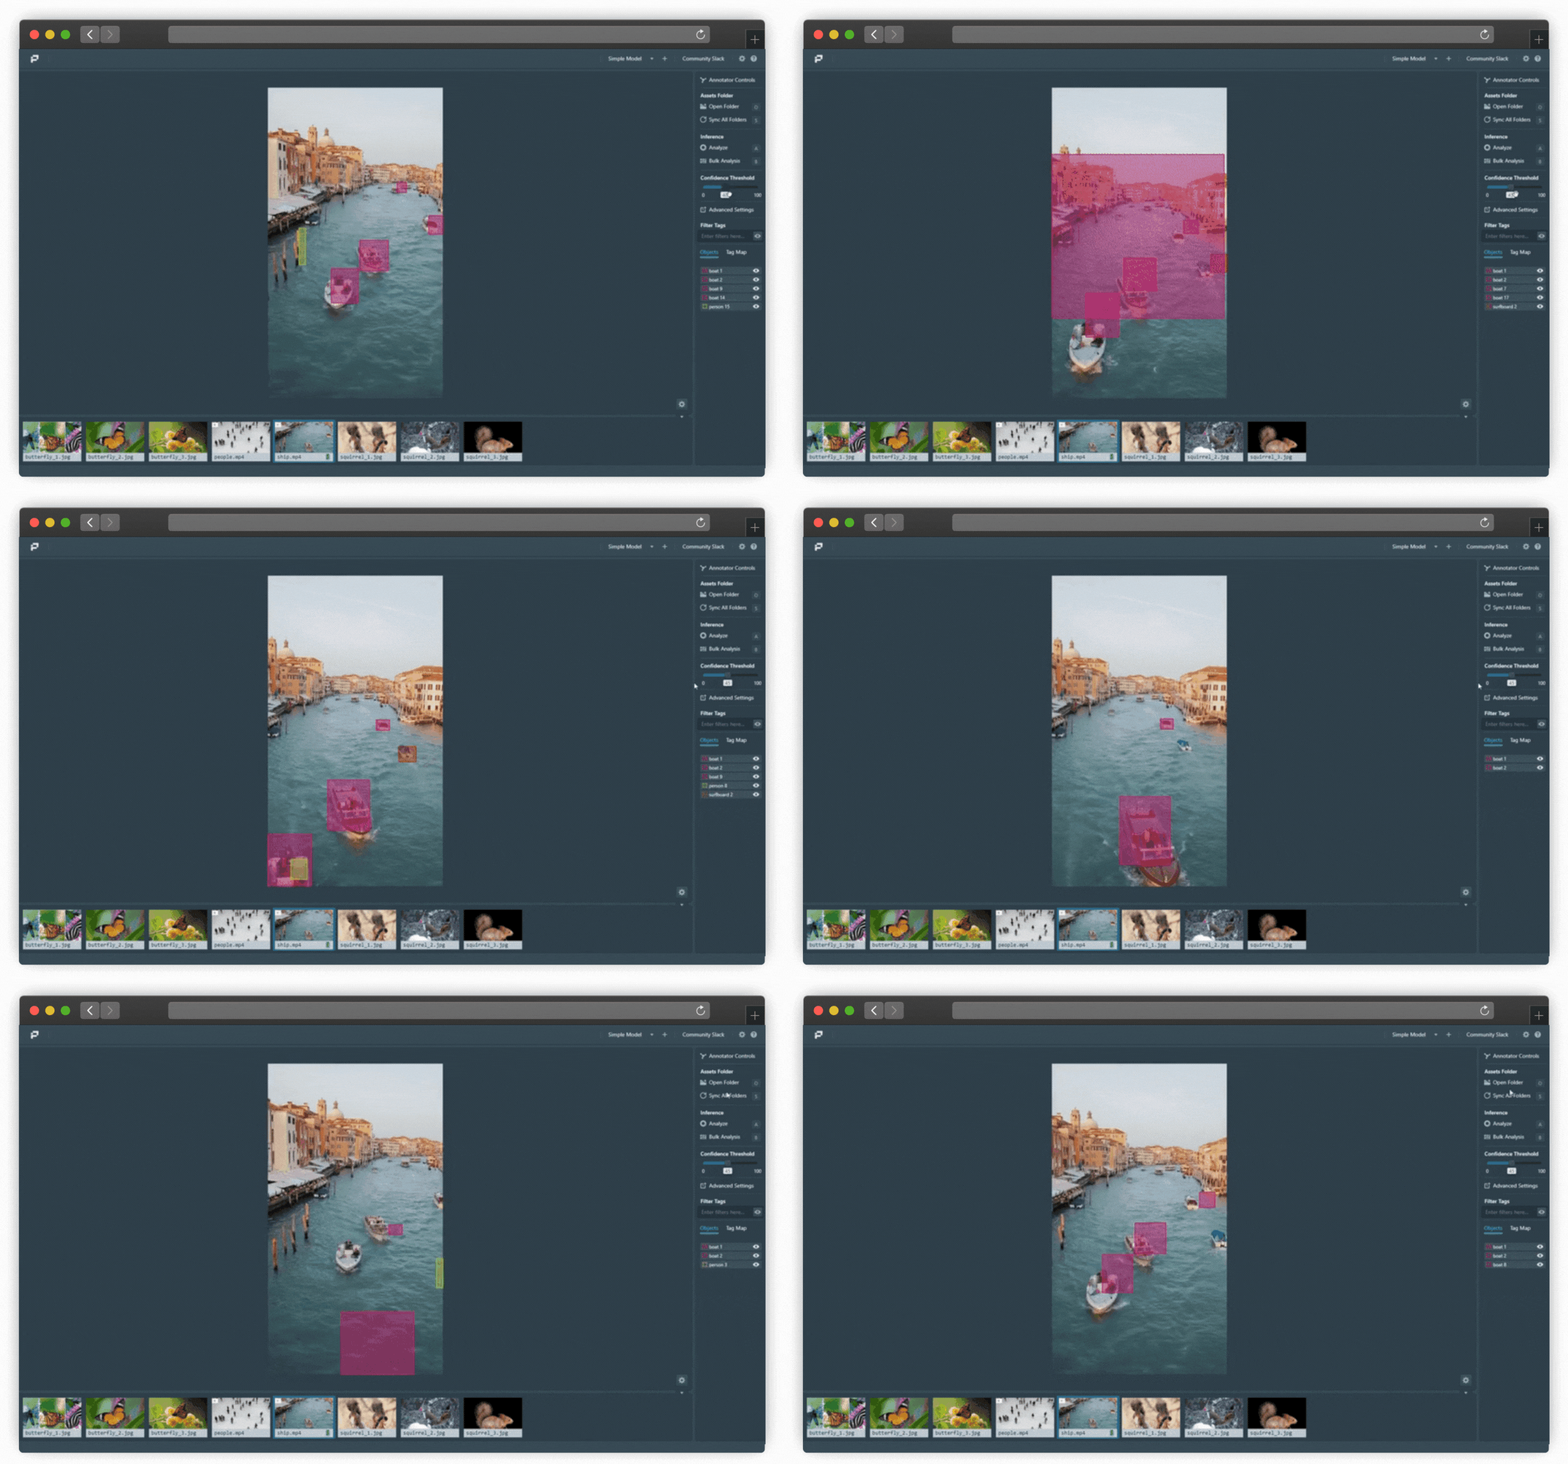
Lower Frame Interval Example (Click image to enlarge)
Updated 4 months ago